Today, in this article, we will talk about the 5 Most Powerful Candlestick Patterns, which actually work. We get to see these patterns regularly in the market. If you are a price action trader and you are new to the stock market, then it is very important for you to know about these 5 Most Powerful Candlestick Patterns.
Through these Candlestick Patterns, you can know what will be the next move of the market. And you can trade easily. So let’s see what these 5 Candlestick Patterns are, how they work, and how they look.
1. Bullish Engulfing
Bullish engulfing candlestick pattern is a trend reversal pattern from a downtrend to an uptrend. Meaning, this candlestick pattern tells us that sellers have lost their control, and buyers have taken control of the market.
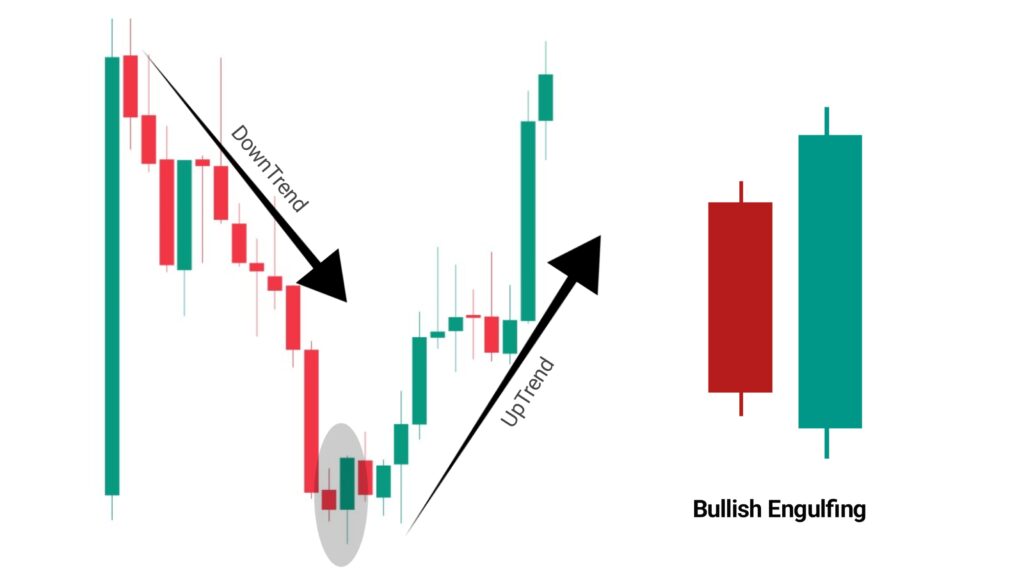
You can see this is a bullish engulfing candlestick pattern, whose first candle will be a selling candle and the second candle will be a buying candle, and the body of the selling candle will be completely inside the buying candle. Meaning the buying candle will completely engulf the selling candle. Here, I have given red color to the selling candle and green color to the buying candle.
It is possible that the colour of the candles on your chart may be different, but the concepts will be the same; the first candle is negative and the second candle is positive. This pattern is formed at the bottom after a significant downtrend. And it gives us a signal that the market can now move up from here. And we can trade trend reversals.
Apart from this, this pattern can also be formed at support; if it is formed at resistance, then it is not valid, and even if it is formed at the top, it is also not valid. Just keep in mind that the market should be in a downtrend, and this pattern should be formed at the bottom.
2. Bearish Engulfing
Bearish engulfing pattern is a reversal pattern from an uptrend to a downtrend. This candlestick pattern tells us that buyers have lost control, and sellers have taken control of the market.
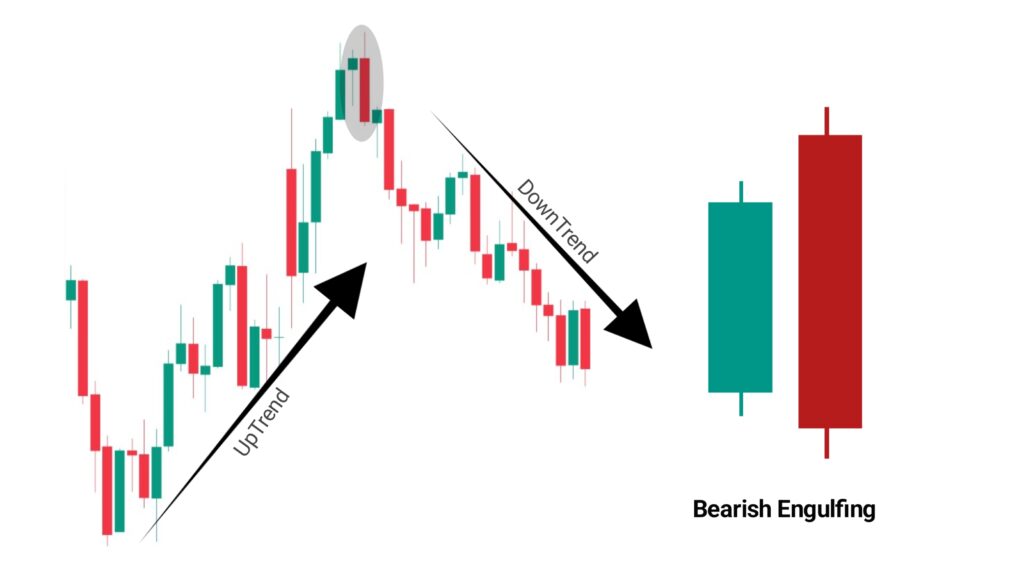
The concept of the bearish engulfing candlestick pattern is the opposite of the bullish engulfing pattern. Its first candle will be a buying candle, and the second candle will be a selling candle, and the body of the buying candle will be completely formed inside the selling candle. That is, the selling candle will completely engulf the body of the buying candle.
Again, I have given green color to the buying candle, and red color to the selling candle. This pattern is always formed at the top after a significant uptrend, from where the market can reverse its trend. It can also form at resistance area. Both of these engulfing candlestick patterns can also be formed on a pullback.
3. Bullish Harami (inside candle)
The bullish harami pattern is also called the inside candle. The formation of this candlestick pattern is exactly the opposite of the engulfing candle. And this bullish harami pattern gives us a signal that the market may reverse its trend from downtrend to uptrend.
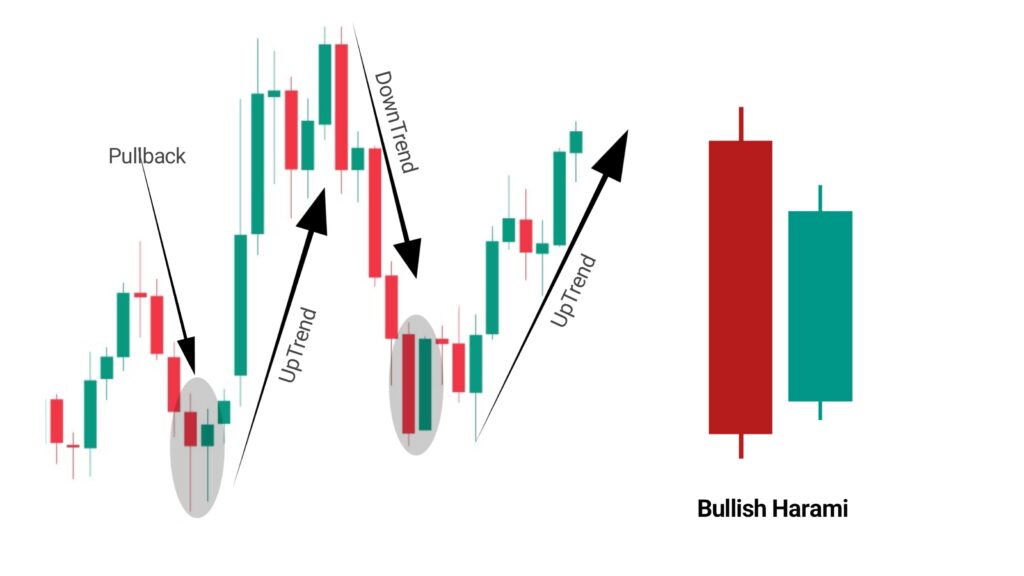
The bullish Harami pattern is formed at the bottom after a significant downtrend, or it can also be formed at a support. This pattern slows down the market movement and creates indecision in the market. The first candle of this pattern will be a big red candle, i.e., a selling candle, which shows that the market is strongly negative.
And the second candle will be a small buying candle, i.e., a green candle. And the body of this buying candle will be completely formed inside the selling candle. From this, we come to know that the sellers could not take the market down, and created a small buying candle inside this selling candle, and this created an indecision in the market.
After this, you have to wait for a confirmation candle. Whenever the next candle is a strong buying candle, then you should understand that the trend can reverse from here. Keep in mind that to trade this pattern, you have to give the highest priority to the confirmation candle.
Because this pattern only creates indecision in the market, slows down the market movement, does not give a trend reversal signal, so the next confirmation candle that will be formed will tell you where the market will go now, so always wait for the confirmation candle.
4. Bearish Harami Candlestick Pattern
Like the bullish harami pattern, the bearish harami pattern also creates indecision in the market, and it gives us a signal that now the market can move from uptrend to downtrend.
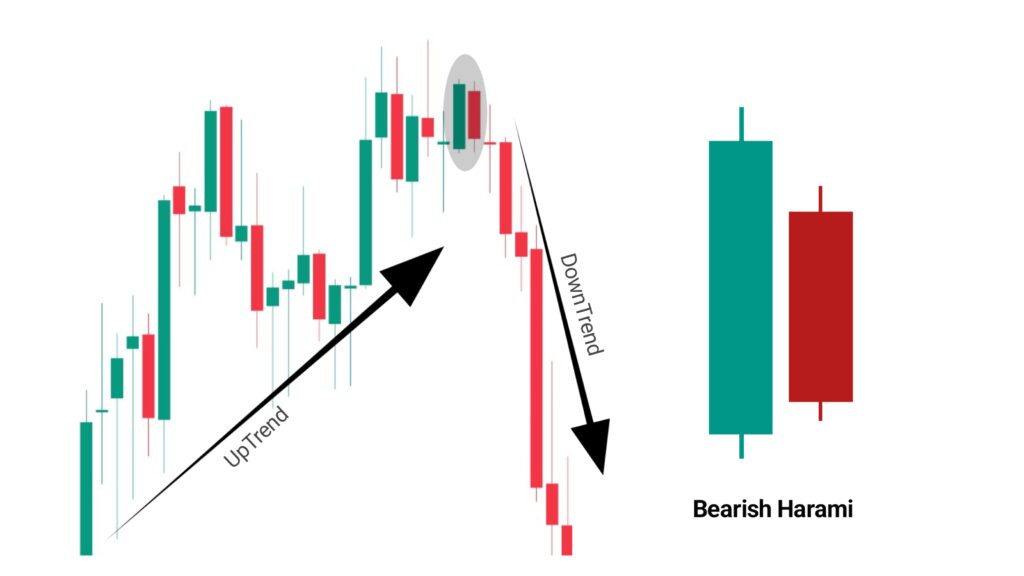
Bearish harami pattern is formed at the top after a significant uptrend, and gives a signal of reversal from there. The first candle of the Bearish harami pattern will be a buying candle, which tells us that the market is completely under the control of buyers.
After that the second candle will be a selling candle, which will be smaller in comparison to the buying candle, and this selling candle will be completely formed inside the buying candle which tells us that the buyers could not take the market up, and closed inside the range of this buying candle, this creates an indecision in the market. But this pattern does not decide that the market will reverse from here.
This pattern only slows down the upward movement of the market and creates indecision. We have to wait for the next candle, If the next candle is a strong selling candle, then the market can reverse from here. This pattern can also be formed at any resistance, or it can also be formed on any pullback.
5. Doji Candlestick Pattern
The doji candlestick pattern is an indecision pattern. This pattern creates indecision in the market. Meaning the market neither goes up nor down. The market opens at a price and then comes back to that price and closes, or closes around that price. Market indecision means the market is neither under the control of buyers nor sellers. Therefore, the market cannot decide where to go next.

In the doji candlestick pattern, we see only wicks; the body of the candle is almost non-existent, or a small body can be formed. Because in the doji pattern, the market closes around the price or closes at the exact price which it opens. Therefore, it does not have a body, or small body is visible. The doji candlestick pattern is neither bullish nor bearish.
Meaning, if this pattern is formed at the bottom, then it is called bullish. But if it is formed at the top, then it is called bearish. Doji pattern does not have any particular color, this pattern can be of black color, green color, or red color. Color does not matter for doji pattern. There are three types of doji patterns….
- Long Legged Doji.
- Dragonfly Doji.
- Gravestone Doji.
These three Doji patterns work on the top as well as the bottom. It works on a pullback as well as on support and resistance. As I mentioned earlier, Doji is an indecision pattern. This pattern does not decide whether the market will go up or down, so we have to wait for the next confirmation candle.
After the Doji candle, if the next candle forms a strong buying candle, then the market can go up, and if a strong selling candle forms, then the market can go down. If the doji candle is formed at the bottom, then you have to look for a strong buying candle, and if it forms at the top, then you have to look for a strong selling candle.
This confirmation candle plays a very important role for the Doji pattern, so whenever you have to trade, trade after the confirmation candle is formed.
Bonus Tips:
If you are a beginner and have come to the stock market for the first time, then let me tell you that you cannot become profitable just by using these candlestick patterns; you have to see and understand many other things.
You have to find the direction of the market properly, understand the structure of the market properly, understand the price behavior properly, apart from this, let me tell you that most trapping happens on support and resistance, so whenever you trade these patterns, do it very carefully, wait patiently, and trade only after good confirmation.
You can also use indicators with these candlestick patterns, which will give you even better confirmation. So the main thing is that you should not trade by relying only on these patterns.