Friends, today in this article, we will talk about the head and shoulders chart pattern. We get to see this pattern regularly on the chart, and it works well. Today we will know how many types of head and shoulders patterns are there, what is the psychology behind it, how this pattern is formed on the chart, and how it works. So let’s understand in detail about the head and shoulders chart pattern.
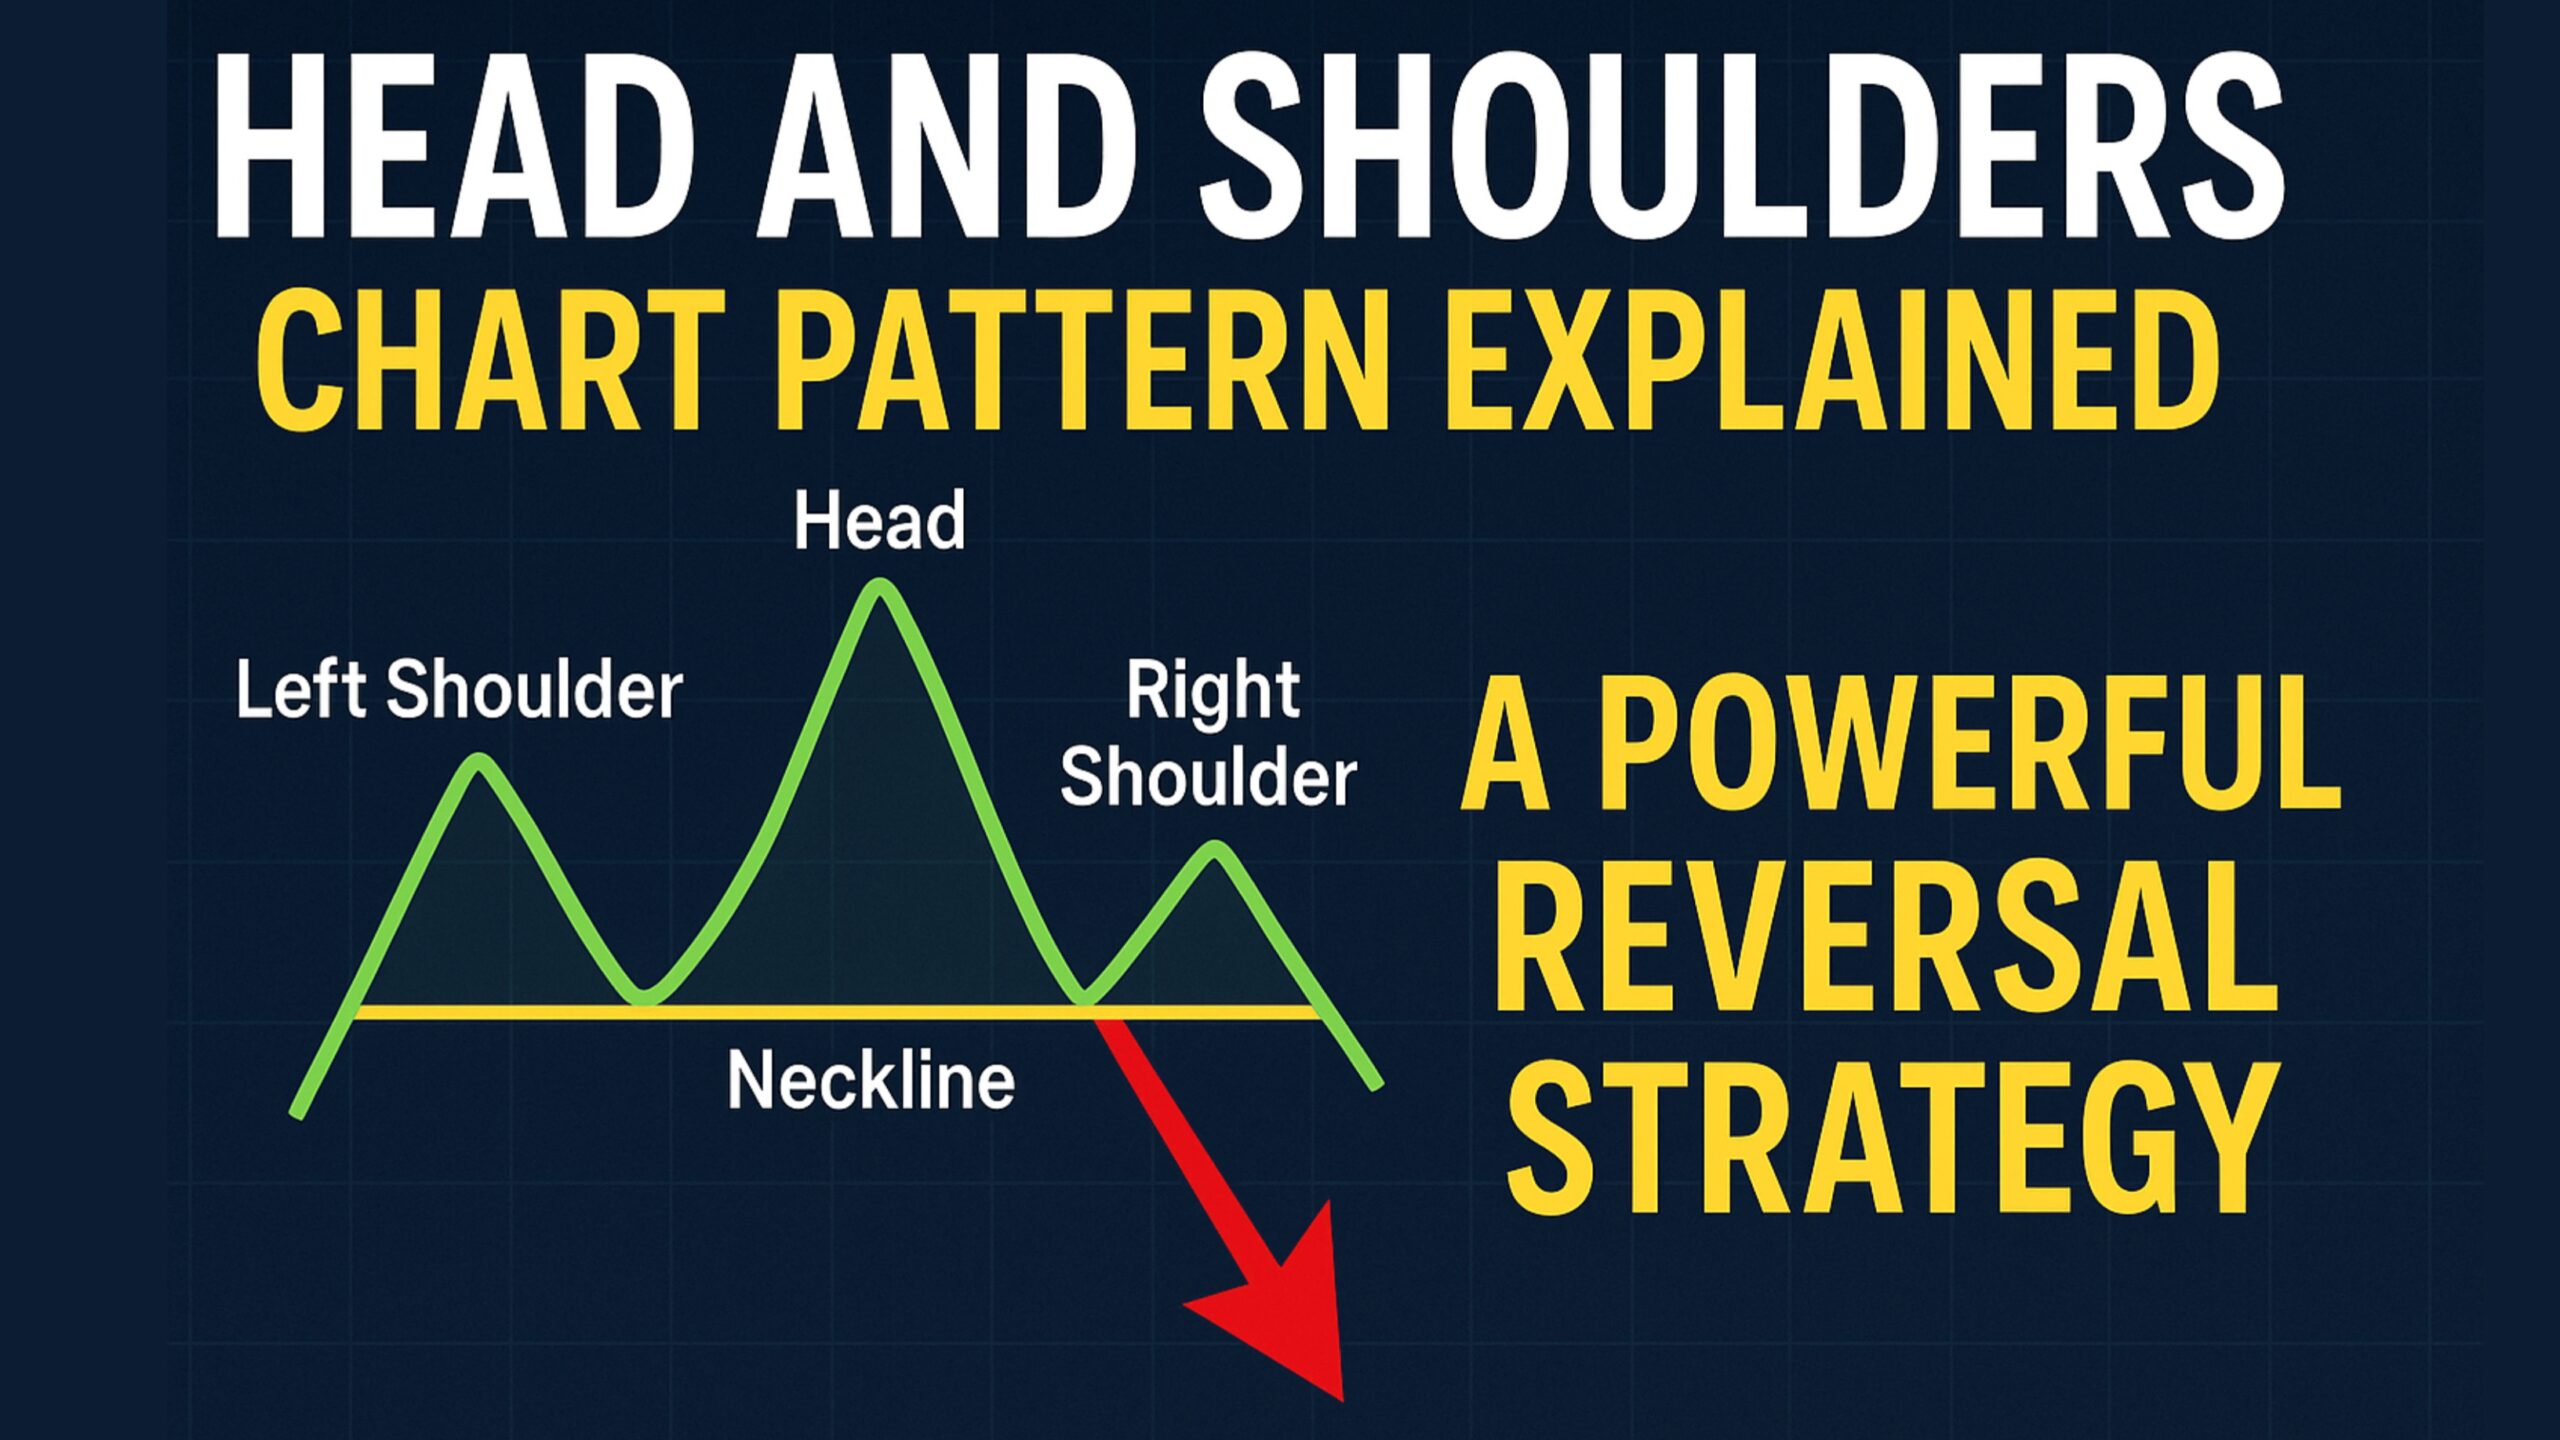
Head and Shoulders Chart Pattern
Friends, head and shoulder pattern is a reversal pattern, which gives us a signal of trend reversal in the market. This pattern can be formed at the top of the chart or at the bottom of the chart. If this pattern is formed at the top of the chart, then it is called Standard Head and Shoulders Pattern or Bearish Head and Shoulders Pattern, and if it is formed at the bottom of the chart, then it is called Inverse Head and Shoulders Pattern or Bullish Head and Shoulders Pattern.
1. Standard Head and Shoulders Pattern (Bearish Pattern)
The standard head and shoulders pattern is a bearish pattern. This pattern is formed at the top after a significant uptrend. This pattern gives us a signal that the market may now reverse from an uptrend to a downtrend.
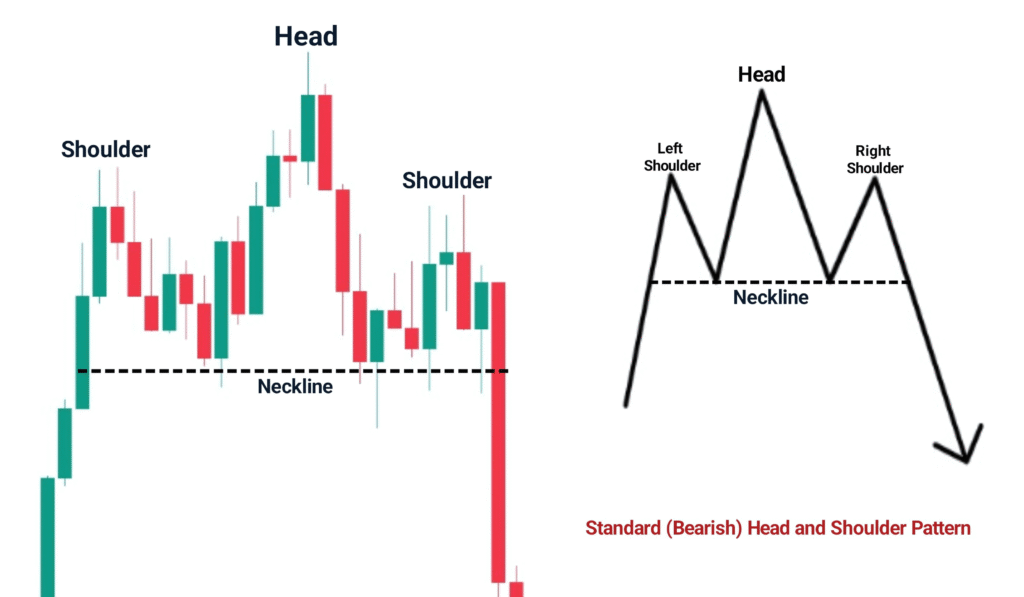
Friends, if we look at the structure of the pattern carefully, we will understand that just like a human body has a head, and the head has shoulders on both sides. This pattern is of the same shape, and hence its name is Head and Shoulders Pattern.
If we talk about the psychology of this pattern, we will start from the beginning. If we look at the lift shoulder, the buyers are very strong. The buyers push the market and a higher high is formed, after that the market pulls back a little and makes a higher low. Till now, the market is completely in the control of the buyers; the buyers push again, and a new higher high is formed in the market, which we will call the head.
The buyers are fully confident that the market will continue its uptrend, but when there is a pullback in the market, the sellers come forward a little and try to bring the market down from here, and hence, the market is not able to make another higher low. The market takes support at the previous low, i.e,. The neckline, and this is now the first sign of weakness of the trend.
After that, the buyers again try to take the market up from the neckline, but the buyers are not able to make a higher high in the market, and a lower high is formed in the market, which we will call the right shoulder. And from there, the market starts coming down. This tells us that sellers are slowly dominating buyers, and buyers are slowly running away.
After that, when the market breaks the neckline, only then we get confirmation that now the market is completely under the control of sellers, and from here the market reverses.
How to Trade Standard Head and Shoulders Pattern
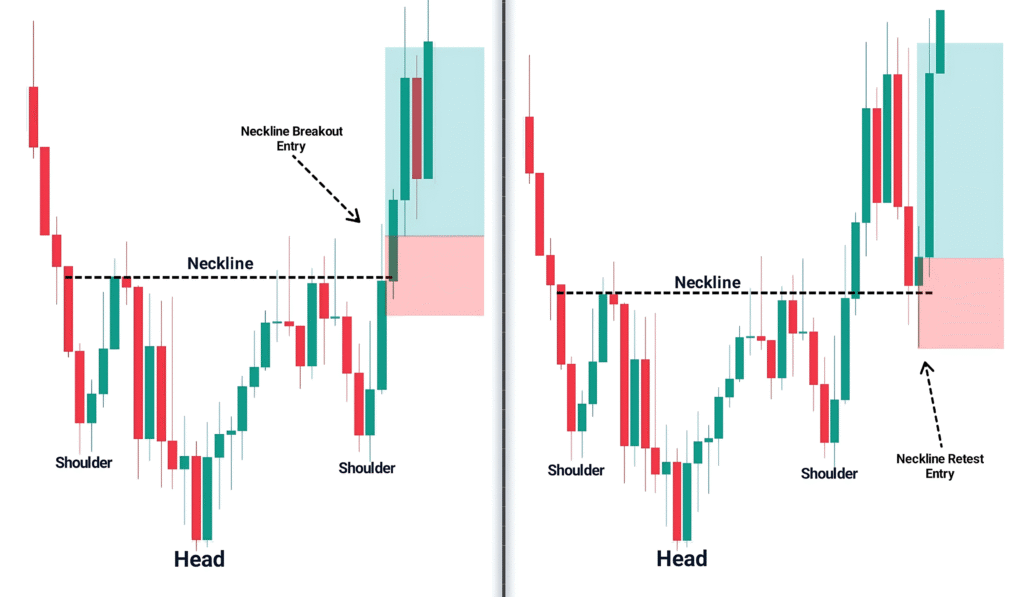
There are broadly two ways to trade the standard or bearish head and shoulders pattern: one is the neckline breakout trade, and the other is the neckline retest trade.
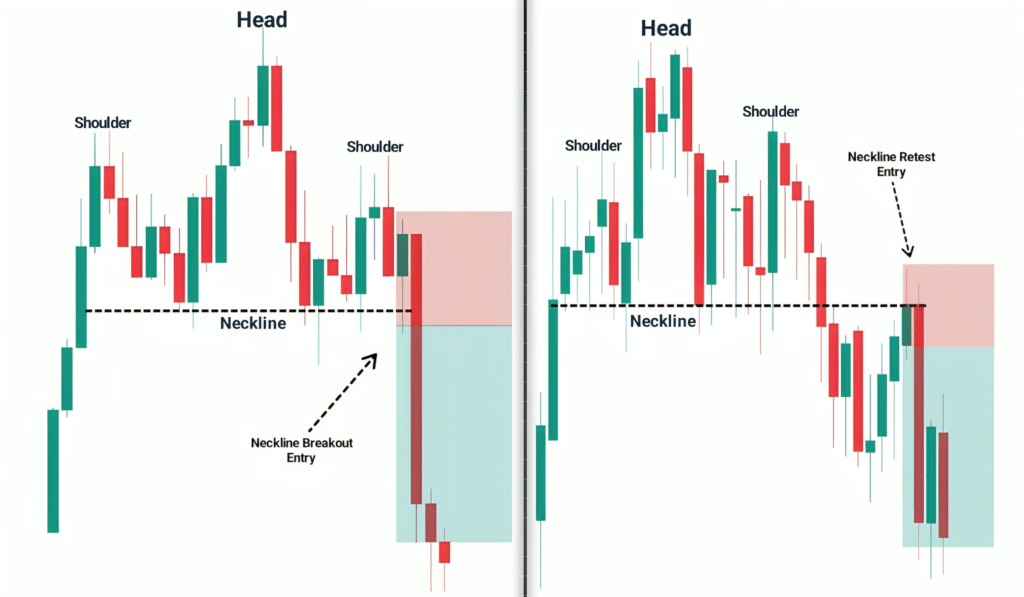
You can see both ways of trading in the image above. You can trade on a neckline breakout as well as a neckline retest. But out of these two, neckline retest trade is safer because sometimes the market reverses straight up after breaking down the neckline. That is, the breakout fails. Therefore, neckline retest trade is safer and more accurate, as compared to neckline breakout trade.
2. Inverse Head and Shoulders Pattern (Bullish Pattern)
Inverse Head and Shoulders Pattern is a bullish pattern. This pattern always forms at the bottom after a significant downtrend. This pattern gives us a signal that the market can now reverse from a downtrend to an uptrend. This pattern is similar to the standard head and shoulders pattern, but it forms upside down at the bottom. That means it is an inverted head and shoulders pattern.
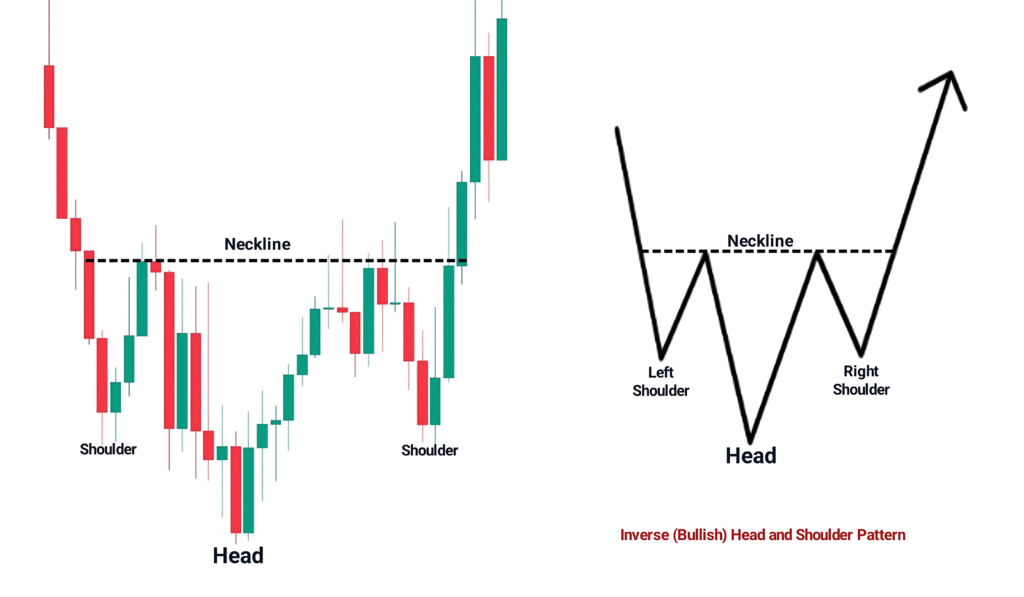
You can see in the image above how this pattern is formed in the opposite direction. If we talk about the psychology behind this pattern, then we will again start from the beginning of this pattern. We see that the market is currently in a strong downtrend. Sellers push the market down, and a lower low is formed, which we will call the left shoulder.
After that, the market takes a slight pullback and a lower high is formed. Till now, the market is completely under the control of sellers. Sellers again push the market down and again form a lower low, which we will call HEAD. Even now sellers are hopeful that the market will continue its downtrend, but when the correction starts coming in the market again, then buyers try to take the market up at this opportunity, and due to this buying pressure the market is not able to make a lower high, and the market takes resistance at the previous high i.e. neckline, this is the first sign of weakness of the downtrend.
After that, sellers try to take the market down again, but sellers are unable to make a lower low, and a higher low is formed in the market, which we will call the right shoulder. The market starts moving up from here, which makes us understand that buyers are gradually dominating sellers. When the market breaks the neckline upwards, then it is confirmed that the market is now completely under the control of buyers.
How to Trade the Inverse Head and Shoulders Pattern
The Inverse Head and Shoulders pattern is traded in the same two ways that the standard Head and Shoulders pattern is traded.
I have shown everything clearly in the image given above, so that it is easy for you to understand. Like the standard head and shoulders pattern, the neckline retest entry is safer in the inverse head and shoulders pattern as well. If you are a beginner, then you have to work on the neckline retest.
Types of Necklines
Friends, there are three types of necklines in the head and shoulders pattern.
- Flat Neckline.
- Upward-sloping Neckline.
- Downward-sloping Neckline.
1. Flat Neckline
This neckline is a straight line. For example, you can see all the images above, all the necklines you will see in those images are flat necklines.
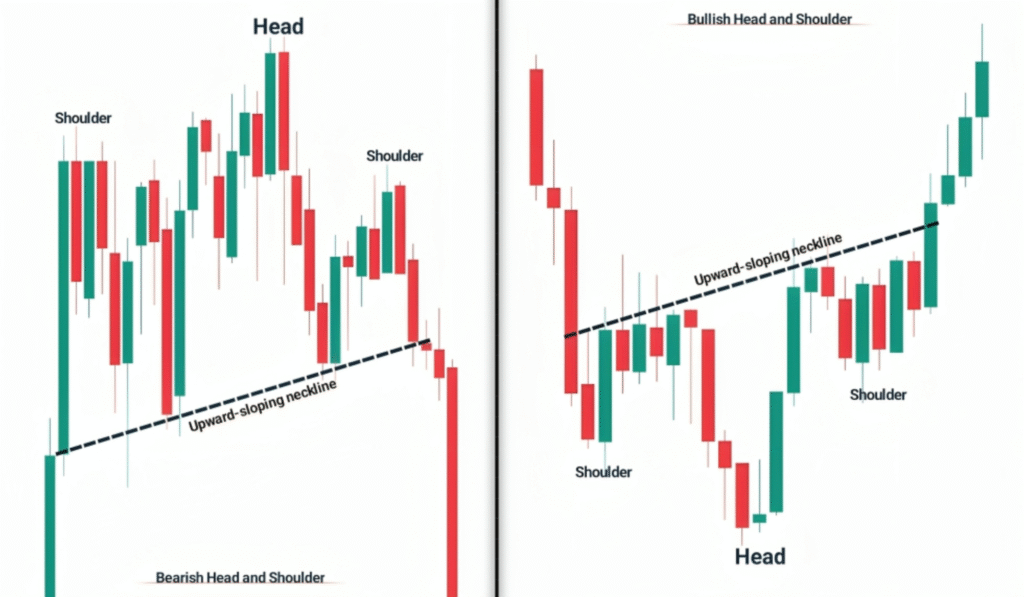
2. Upward-sloping Neckline
The image below shows the upward sloping neckline of the standard and inverse head and shoulders pattern.
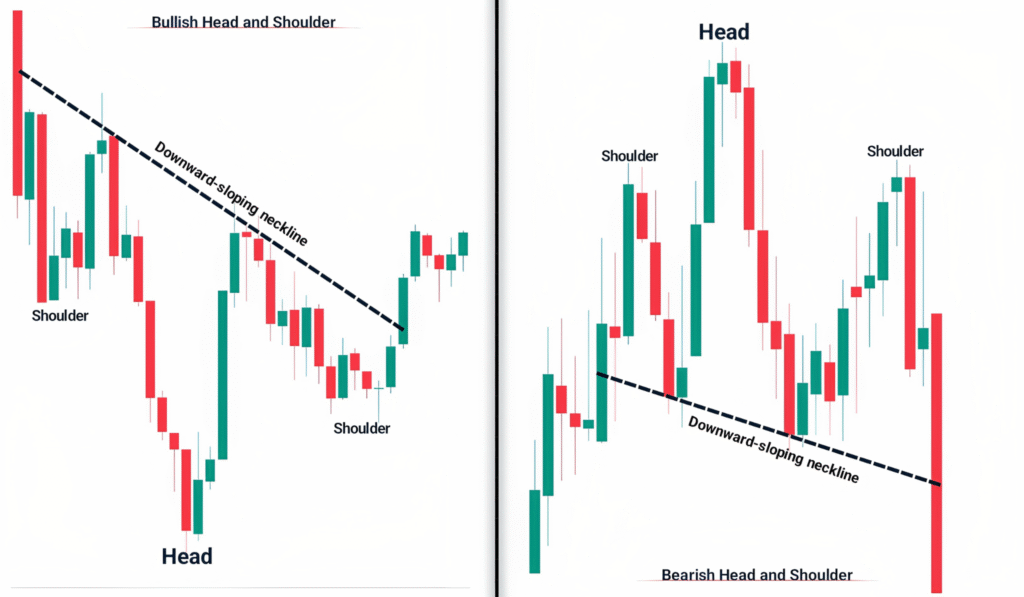
3. Downward-sloping Neckline
Below is an image showing the downward sloping neckline of a bullish and bearish head and shoulders pattern.
Keep in mind that Head and Shoulders or any other pattern does not work 100% in the market; sometimes it works, and sometimes it fails. So, do not make any decision just by relying on these patterns. You have to understand the market sentiment, the behaviour of the price chart well, learn it, and at the same time follow proper risk management, only then can you get some results.