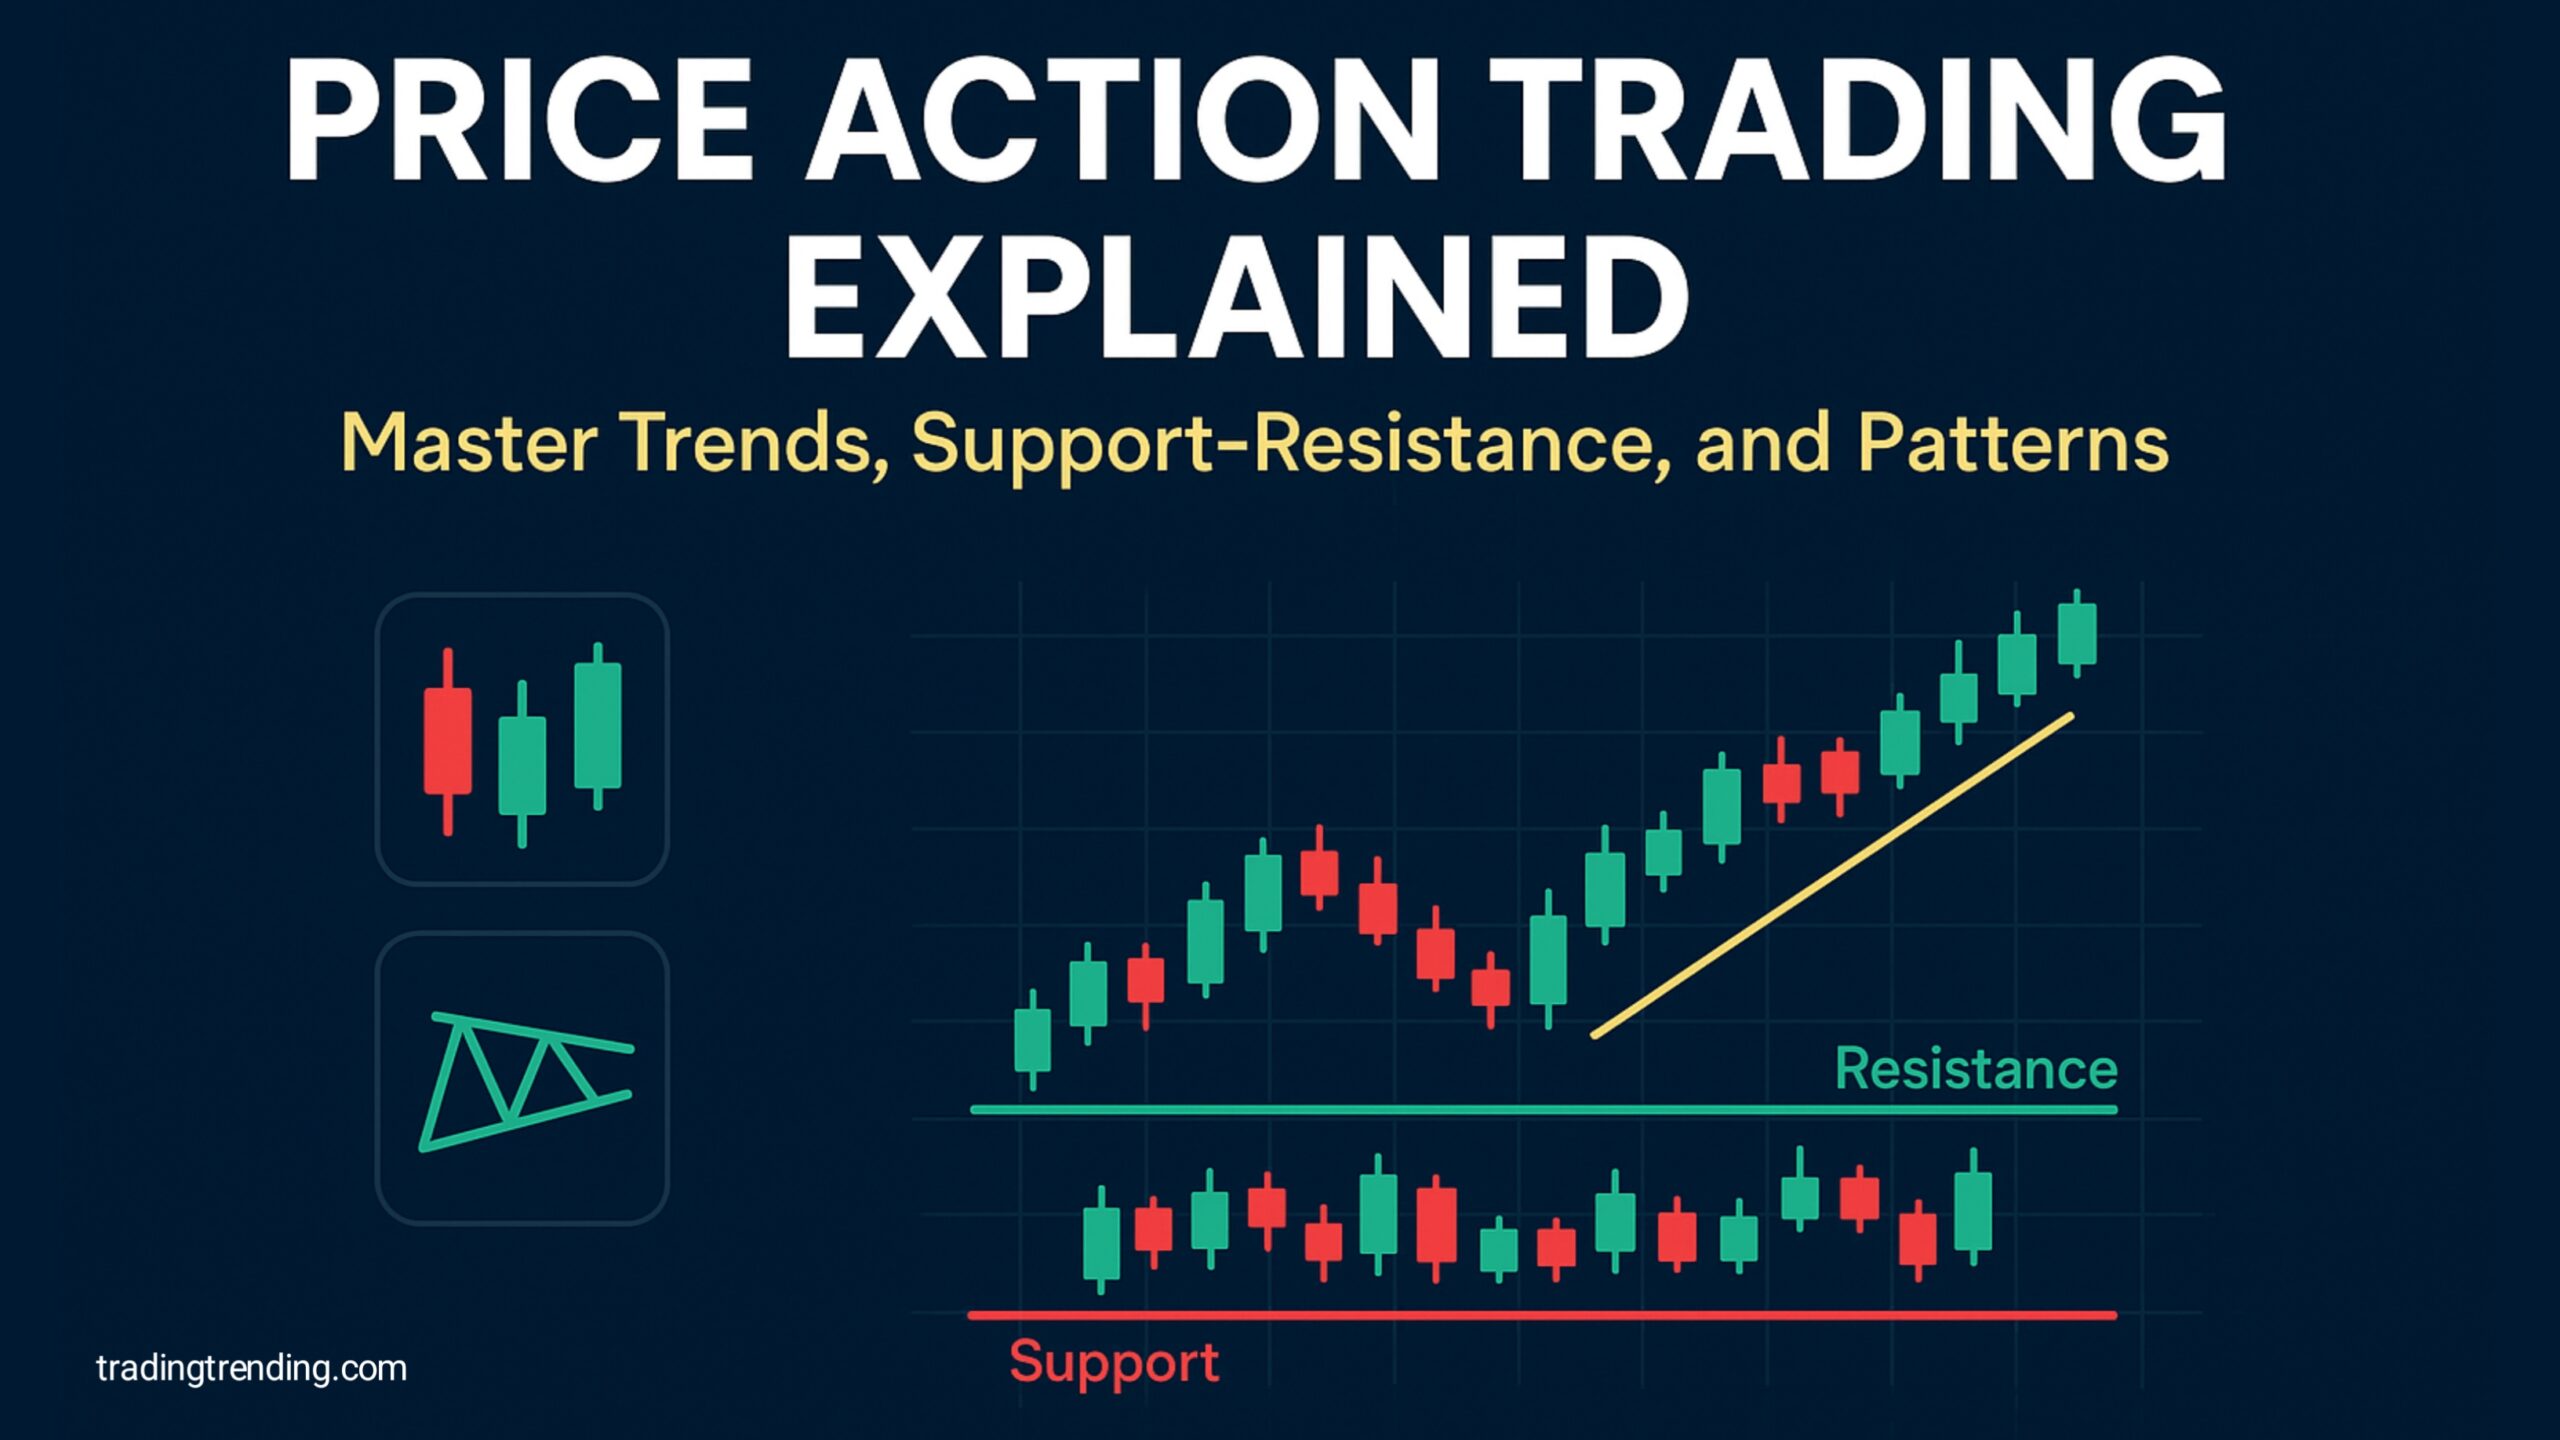
Today, in this article, we will understand price action trading in detail, in which we will talk about what is uptrend, what is downtrend, and what is sideways market. Apart from this, we will talk about what is support and resistance, how to trade it, and we will talk about some important candlestick patterns and chart patterns that actually work. So let’s see how price action trading is done.
What is price action trading?
Price action is a part of technical analysis, with the help of which we trade in any market. Price action means studying the price of a single stock and understanding what will be the next action or the next move of the price of that particular stock. That is, the action taken by the price of any stock is called price action. It can be a stock, or it can be crypto, or it can be a forex pair. Every asset has a price, and it is formed through the price chart.
We have to decide whether to buy, or sell, or hold by looking at the movement of this price chart. No technical indicators are needed to understand price action. The price always moves in patterns, and we have to study those patterns. Now we will study market trends, support & resistance, and some important chart patterns and candlestick patterns that actually work.
What is Support and Resistance?
Whenever the market repeatedly falls below a particular level, it means that the market is not able to break that particular level and go up. The market is repeatedly being pushed below that level; that particular level is called resistance, that is, the market is resisting at that level.
And whenever the market is repeatedly moving up from a particular level, is unable to break that particular level and go down, the market is repeatedly being pushed up from that level, that particular level is called support. Explained in more detail below with an image.
Support:
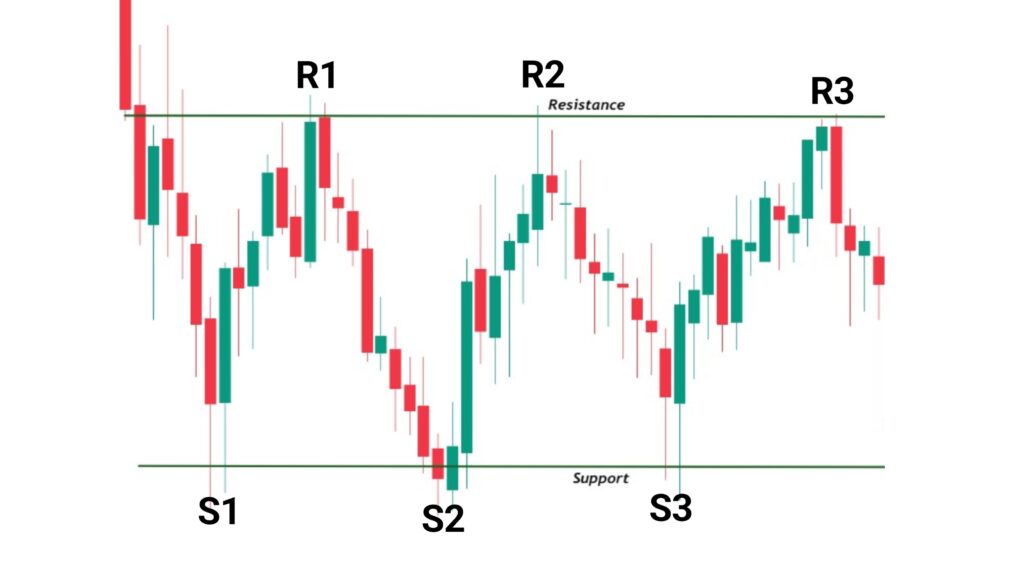
You can see the image given above, the market was going down and suddenly reversed above a particular level, which I have marked with S1. It means the market has taken support at this level only once; after that, the market again came to this level (S1) and reversed again, which I have marked with S2, meaning the market has taken support at the same level twice.
After that, the market again came to this level (S1, S2) and went up again, which I have marked with S3, meaning the market has now taken support at the same level three times, and the market is not able to go below this level. Now, if the market breaks this level downwards, then we can do a selling trade.
Resistance:
If you look carefully at the image given above, you will find that just as the market has taken support at a level below, similarly the market has also taken resistance at the same level above, which I have marked with R1, R2 and R3. Meaning the market is not able to go above that level. The market is being pushed below that level again and again. During this time, if the market breaks the resistance level upwards, then we can do buying trade.
If I explain it to you in a simple language, suppose you are inside a room, and you want to jump out of that room, but you will not be able to get out from above, because there is a roof above your head, which is preventing you from going up, meaning this roof is acting as a resistance for you.
But if you climb up the stairs and stand on the roof of this room, then that ceiling is not letting you fall down, meaning that roof has become a support for you, in the same way support and resistance work in the market. Support does not let the market fall down, and resistance does not let the market go up. But once the market breaks this support or resistance, we get to see a big move.
UpTrend, DownTrend, and Sideways Market
Now we will understand what is uptrend, what is downtrend, what is sideways market, how to find them and how to trade, let us understand with examples.
UpTrend:
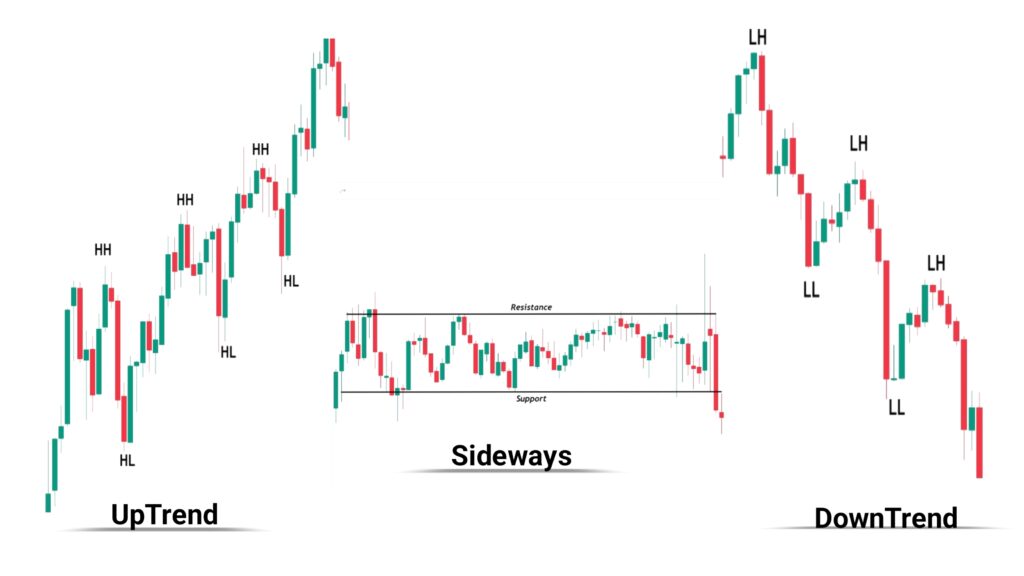
There is a rule of the market that the market never moves straight; wherever the market has to go, it goes doing up and down. If the market has to go up, then the market goes up and down, making higher highs and higher lows. If you see the left side chart of the image given above, then you will know how the market is going up, making higher highs and higher lows, which I have marked with HH and HL, and we will call it UpTrend.
During this time, if you want to trade, then you have to draw a line from bottom to top and connect all the HL, and this line will work like a train line support, meaning whenever the market goes up, it goes up taking support on this trendline. During this time, if the market breaks this trend line downwards, then you can take a selling trade. And if again it goes up taking support on this trendline, then you can take a buying trade by following the trend.
DownTrend:
Just like the market does not go straight up, similarly, the market does not go straight down either. The market goes down, moving up and down. Just like in the case of UpTrend, the market went up, making higher highs and higher lows; similarly, the market goes down, making lower highs and lower lows. If you see the chart on the right side of the image given above, then you will know how the market goes down, making lower highs and lower lows. We call this DownTrend.
During this, we have to draw a line connecting all the lower highs from top to bottom, and whenever the market breaks this trendline upwards, we can take a buying trade. And if the market goes down, taking resistance on this trendline, then we can take a selling trade by following the DownTrend.
Sideways Market:
Sideways market means the market moves in a straight direction. Neither the market goes up nor the market goes down. Neither the market makes higher highs and higher lows, nor the market makes lower highs and lower lows. If you see the chart in the middle of the image above, you will see how the market is moving in a straight direction, going up and down in the same range. This is called a sideways market.
And we do not trade in such sideways markets most of the time. We wait for the breakout of support or resistance. Whenever the market breaks out of the support or resistance, then we take the trade.
Technical Indicators
Newcomers to the stock market face a lot of problems in finding support, resistance, and market trends. They do not understand which support or resistance is correct, which support or resistance is wrong, which is the clear direction of the market.
So, I will tell you two indicators, out of which one indicator will find the direction of the market, and the other indicator will find accurate support and resistance every day, which actually works.
1. Supertrend
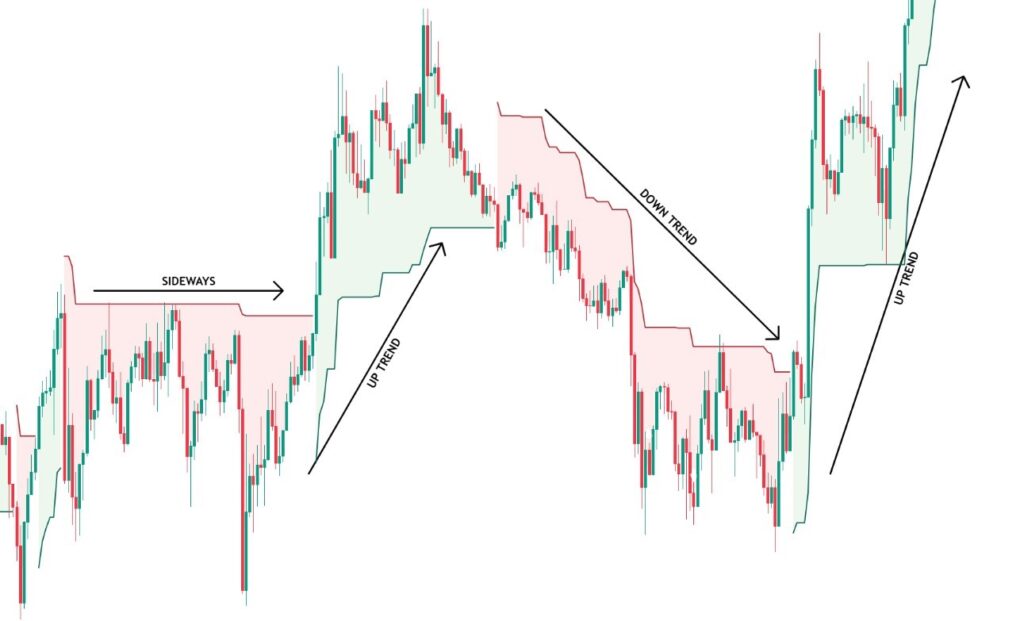
You can see this indicator in the image given above, its name is “Supertrend” which will clearly tell you the direction of the market, as you can see in the image. Whenever the market is above the green line, then understand that the market is in uptrend, and whenever the market is below the red line, then understand that the market is in downtrend. You can apply this indicator to any time frame.
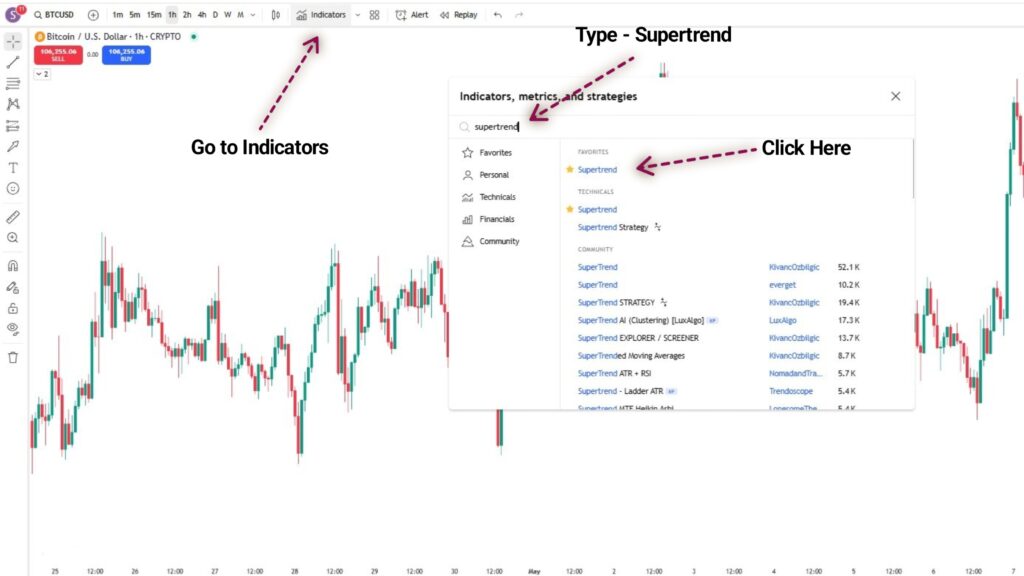
To apply this indicator on the chart, you have to go to TradingView.com, after that you have to click on the indicators, after that you have to search “Supertrend” on the search bar, and click on the supertrend that appears at the top. The indicator will be automatically applied to your chart. So that you do not face any problem, I have given an image above, you can apply the indicator by looking at it.
2. Pivot Points Standard
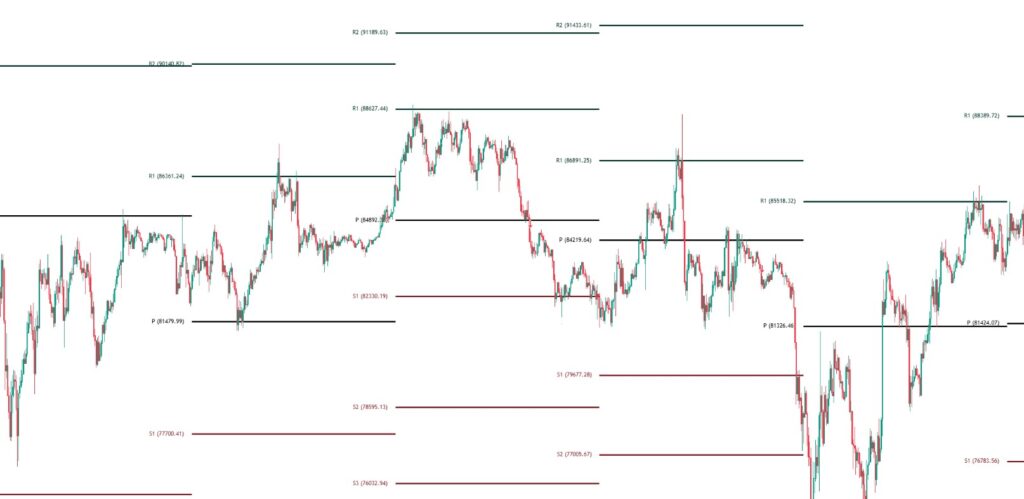
The lines you see on the chart are the Pivot Points standard indicator. The red lines you see are support level, and the black lines you see are resistance level. This indicator will find such support and resistance for you every day. By default, these lines have different colors; you can change them and you can also make these lines thinner or thicker.
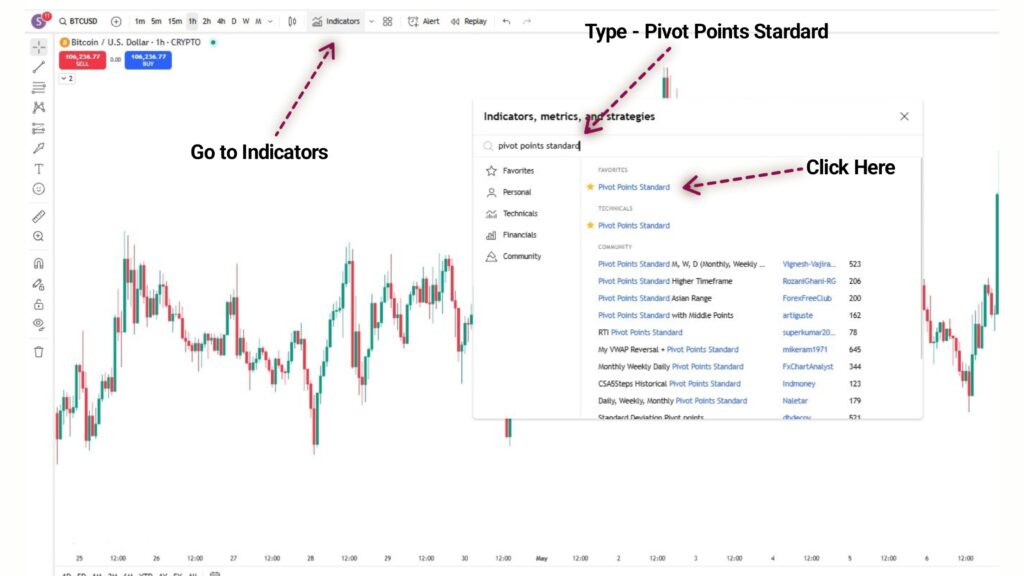
To apply this indicator, you have to go to TradingView.com again, click on the indicator, then type “Pivot Points Standard” on the search bar, click on the indicator that comes first, and this indicator will be automatically applied on your chart. For better understanding, I have given an image above, you can apply the indicator by looking at it.
Friends, that’s all for today. Whatever I told you, backtest it well and practice it in the live market. In the next article, we will talk about the most important candlestick patterns and chart patterns that actually work in the market. Stay with us for this, thank you.