You must know how important role candlestick patterns play for a trader. Japanese candlestick patterns help us to enter the market in a better way and set stop loss. With the help of candlestick patterns, we get an idea in advance about what the next move of the market can be. Therefore, it is very important for every trader to understand candlestick patterns well.
We get to see many candlestick patterns in the market. Some of those patterns give good results, and some patterns do not give as good results. Today, in this article, I will tell you about the top 5 Japanese candlestick patterns that really work well in the market. Every trader should know about these candlestick patterns.
1. Hammer Candlestick Pattern
Hammer is a single and bullish candlestick pattern. We normally see this pattern at the bottom of the chart. If this candlestick pattern is formed at the bottom of the chart after a significant downtrend, then the trend often reverses from there. This pattern can also be formed at any support level or on any pullback.
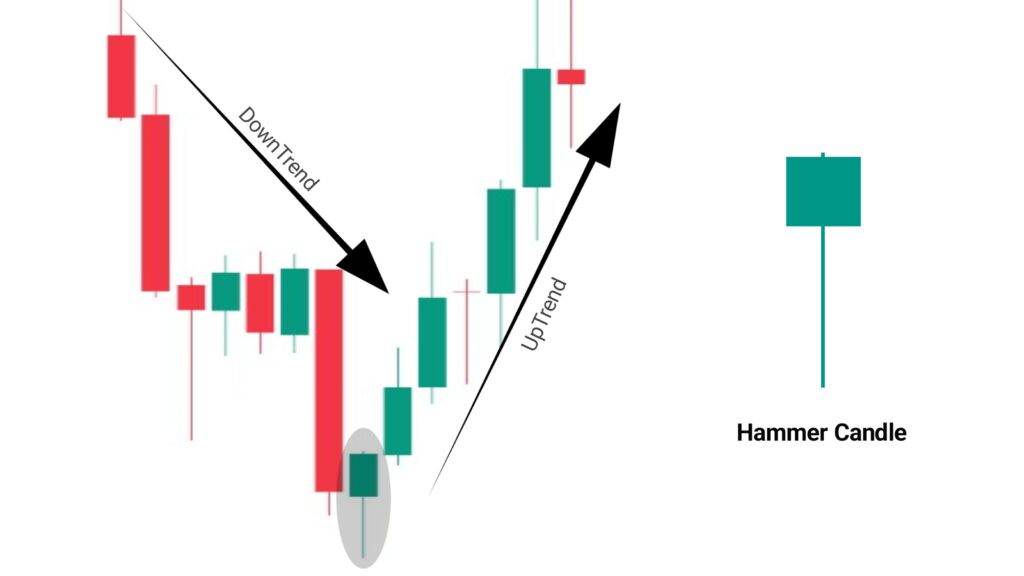
This pattern was named Hammer because this pattern looks like a hammer. This pattern tells us that the market continues its downtrend and sellers push the market down, but suddenly buyers become active and push the market very fast and close it around the opening price or above the opening price. Therefore, the lower wick of this candle is very large. This candlestick pattern tells us that the buyers have become very strong.
Keep in mind that the body of the hammer pattern should not be too big; the body will be small, and the lower wick will be big. The lower wick should be at least 2 times bigger than the body. Remember that the bigger the lower wick of the candle, the stronger the pattern will be. The upper wick is almost non-existent, or a very small wick is seen. If this pattern is formed after a strong downtrend, then it works well. Whenever you trade the hammer pattern, trade only after a confirmation candle is formed; this will give you better results.
For the hammer pattern, the color does not matter much, but if it closes above the opening price, i.e., if it forms a green candle, then it is considered a strong hammer candle. And if it closes below the opening price, i.e., if it forms a red candle, then its accuracy is a little less, but it is still valid.
2. Hanging Man Candlestick Pattern
Hanging man is a bearish candlestick pattern. This pattern looks exactly like the hammer candlestick pattern. Both have the same shape, but the concept is different. Hanging man always forms at the top after an uptrend, and from there it gives a signal of reversal in the downtrend.
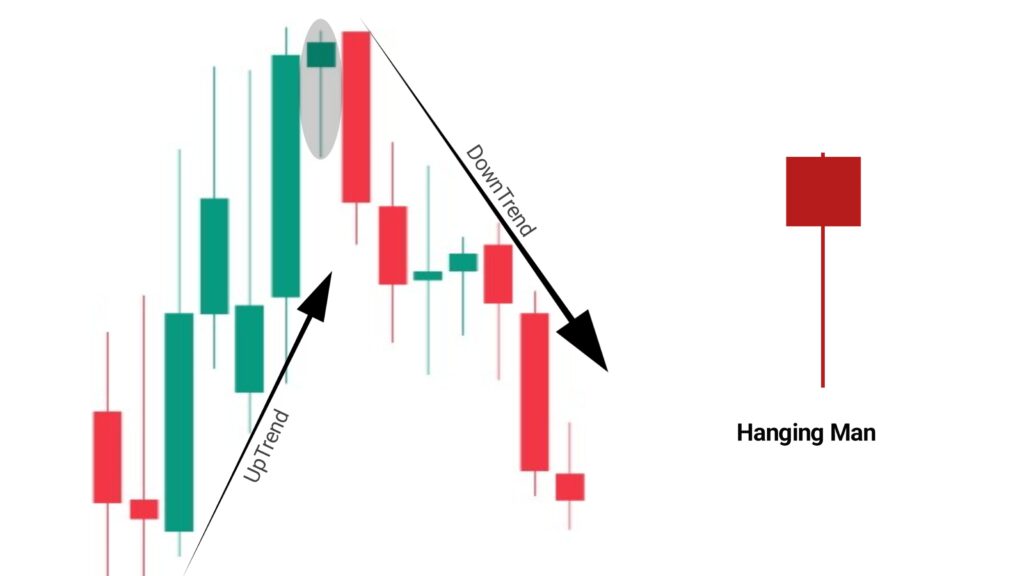
So if we talk about the psychology of the Hanging Man candlestick pattern, then in the image above we can see that the market is on an uptrend. If we look at the previous candle of the Hanging Man, then there was strong buying pressure in the market and a strong green candle (buying candle) was formed. After that, when the market opened on the second candle, the market started falling from the opening price but the buyers were strong, that is why the buyers pushed the market and the market recovered. Because of this, the lower week of the Hanging Man is quite large. Buyers make the market close around the opening price.
But if we see, suddenly the second candle is a strong selling candle, which breaks the low of the hanging man and closes below it, this tells us that the sellers have become very strong in the market, the market has come under the control of sellers. Seeing this, buyers start cutting their positions out of fear, and at the same time, new sellers enter, due to which there is a lot of selling pressure here, and the market falls.
Remember that the lower wick of the hanging man candlestick pattern is large and the body is small, the upper wick is almost non-existent or can be seen as small. The lower wick of the hanging man should be at least 2 times larger than the body; however, the larger the lower wick, the more accurate the hanging man will be and the better it will work. Color does not matter much for the hanging man pattern, but if it forms a red candle, meaning a selling candle, then it is given more importance.
And always remember one thing, the confirmation candle is very important for hanging man, because hanging man does not give us a signal of reversal, its next candle tells us where the market will go. After hanging man, if the next candle is a strong selling candle and breaks the low of hanging man, then we can do a selling trade. Rest, if you see the image given above then you will understand everything.
3. Shooting Star Pattern
Shooting Star is a bearish candlestick pattern, which is a powerful reversal pattern. This pattern always forms at the top after an uptrend, and gives us a signal that the market can now reverse into a downtrend from here. Now we will discuss in detail about the Shooting Star candlestick pattern below.
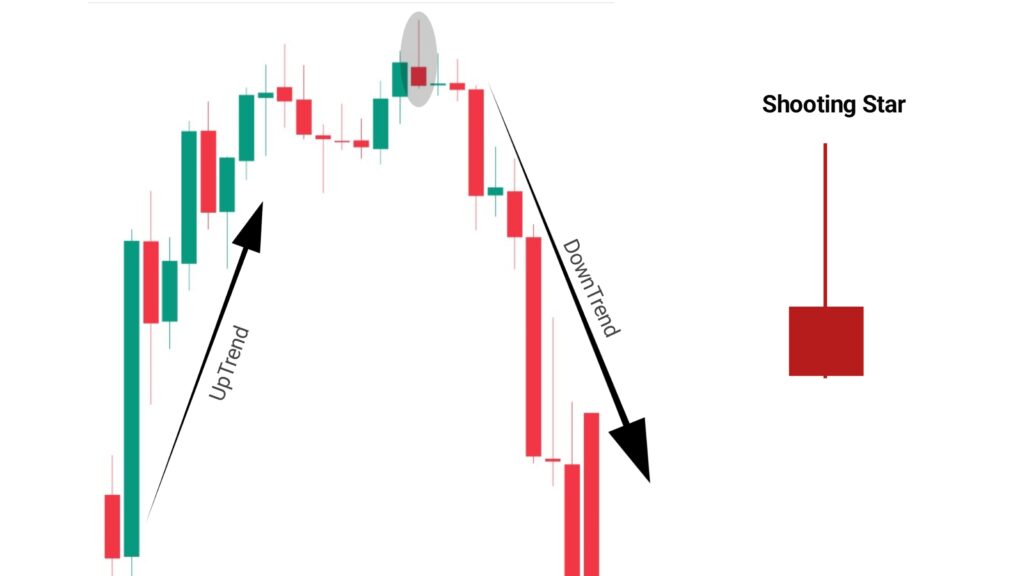
You can see in the picture that the market was bullish, buyers were trying to take the market up as usual, but suddenly sellers enter aggressively, and the market gets rejected from above. Sellers close the market around the opening price; therefore, the upper wick of the shooting star candle is large, the body is small, and almost no lower wick, or a very small lower wick can be seen.
This shooting star pattern tells us that the market can reverse from here, but we have to wait because we cannot say without confirmation that the market will reverse from here, so we have to wait for a confirmation candle. If the confirmation candle is a selling candle, which we call a red candle, and that selling candle breaks the lower price of the shooting star, then we have to understand that the market is now under the control of sellers, and now a reversal can be seen from here.
Experienced traders often trade without any confirmation candle, but that is very risky, so if you are a beginner trader, you have to trade only after a confirmation candle is formed. Color does not matter much for the shooting star candlestick pattern, but if this shooting star candle is a selling candle, which we call a red candle, then it works better.
4. Morning Star Candlestick Pattern
Morning Star candlestick pattern is a bullish reversal candlestick pattern. This pattern tells us that the market can now shift from downtrend to uptrend. Morning star is a 3-candlestick pattern; this pattern always forms at the bottom after a downtrend. Let’s see what this morning star pattern looks like, what is the psychology behind it, and how it works.
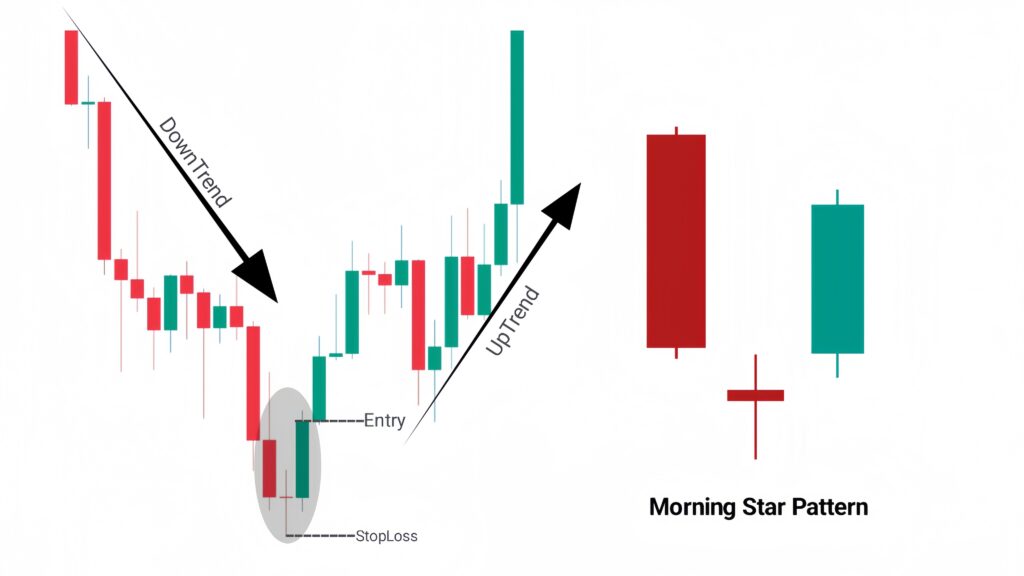
The first candle of the morning star pattern will be a red candle, i.e., a selling candle. After that, the second candle will be a small size candle; it will have a small body, or it can become a doji candle. After that, the third candle will be a long green candle, i.e., a buying candle.
The long rate candle tells us that the market is in a downtrend and the market is currently under the control of sellers. The second candle that will be formed after that will have a small body or it can be a doji candle. It tells us that the market is currently in an indecision situation and there is weakness in the downtrend. The third buying candle that will be formed after that tells us that the market is now under the control of buyers and from here we might see a reversal.
For your information, I have given red color to the selling candle in this image, and green color to the buying candle. In the case of Morning Star, the first candle will be a red candle, and the color of the second candle does not matter; it can be red or green, and the third candle will be a green candle.
5. Evening Star Pattern
Evening star candlestick pattern is exactly opposite to morning star pattern; this pattern is a bearish candlestick pattern. Evening star is a three-candlestick pattern, meaning this pattern is formed by combining three candles. This pattern always forms at the top after an uptrend, and gives reversal signals from there.
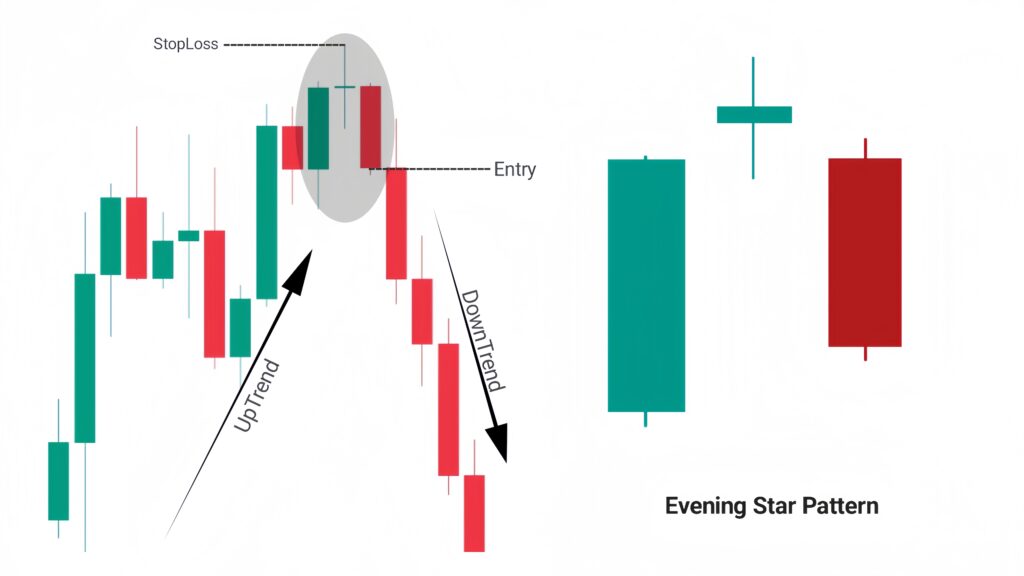
The first candle of the Morning Star is a bullish candle, which tells us that the market is fully under the control of buyers, the market is currently continuing its uptrend. The second candle that will be formed after that will be a small size candle, or it can also be a doji candle, which tells us that the market is currently in indecision mode, and the uptrend of the market seems to be weakening. After that, the third candle will be a bearish candle, which tells us that the buyers have lost their control over the market, and the market has now come under the control of sellers, that is, the market can reverse from here.
In the case of Evening star pattern, the first candle should be a bullish candle, which I have coloured green, and the second candle is a small sized candle; its colour does not matter, the middle candle can be of any colour. And the third candle will be a selling candle, which I have coloured red.
For your information, do not trade by relying only on candlestick patterns. We have to see and understand many other things. We have to understand the structure of the entire chart, understand supply and demand, understand the behavior of the market. If you do not know anything about the market, then first learn and understand it, and then take any decision.